Item Nested Grid
What's This?
This example shows how we can use the grid with nested column spans. First, we define
a "row" with <div class="row">. Then
we nest the item content itself in two .span6 columns in order to further separate the Item stimulus from
the Item stem (prompt and interaction). The result is a nice visual trick that "chunks" the item for the student, making it
easy to view the stimulus and the stem in the same viewport.
Other Cool Things You Can Do
1. We use the "well" class to add visual importance around the "Prompt" portion of the Item like so:
<div class="well">
  Sample content here...
</div>
2. We use the handy "section heading" classes to add even more visual importance to the prompt:
<div class="section heading">
  <h4>Prompt</h4>
</div>
| Get Responses: | [ Click Get Responses ] |
<?xml version="1.0" encoding="UTF-8"?>
<assessmentItem xmlns="http://www.imsglobal.org/xsd/imsqti_v2p1" xmlns:xsi="http://www.w3.org/2001/XMLSchema-instance"
xsi:schemaLocation="http://www.imsglobal.org/xsd/imsqti_v2p1 http://www.imsglobal.org/xsd/imsqti_v2p1.xsd"
identifier="I000050048" title="00005.0048" adaptive="false" timeDependent="false">
<responseDeclaration identifier="RESPONSE" cardinality="single" baseType="string">
  <scoreParam name="CRPS">
    <value>CrScoreOnly</value>
  </scoreParam>
</responseDeclaration>
<outcomeDeclaration identifier="I000050048" cardinality="single" baseType="integer" />
<itemBody>
  <div class="row">
    <div class="span6">
      <p>
        This scatterplot shows the relationship between the number of hours students studied for a final algebra
        examination and each student's score on the examination. Each point represents one student. George
        approximates the data and draws a line of fit through (1,52) and (10,86).
      </p>
      <div class="center pad8 margin8">
        <img alt="scatterplot" src="assets/0000.50047.gif" />
      </div>
    </div>
    <div class="span6">
      <div class="well">
        <div class="section heading">
          <h4>Prompt</h4>
        </div>
        <ol>
          <li>
            Explain lorem ipsem dolor.
          </li>
          <li>
            Lorem ipsum dolor sit amet, consectetur adipiscing elit. Duis vitae est ac lectus aliquam commodo
            ac vel est. Explain how you found your answer.
          </li>
        </ol>
        <extendedTextInteraction responseIdentifier="RESPONSE" class="height-medium" expectedLength="500" />
      </div>
    </div>
  </div>
</itemBody>
</assessmentItem>
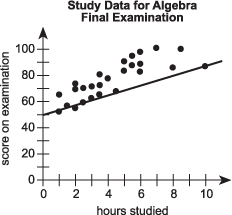
This scatterplot shows the relationship between the number of hours students studied for a final algebra examination and each student's score on the examination. Each point represents one student. George approximates the data and draws a line of fit through (1,52) and (10,86).

Prompt
- Explain lorem ipsem dolor.
- Lorem ipsum dolor sit amet, consectetur adipiscing elit. Duis vitae est ac lectus aliquam commodo ac vel est. Explain how you found your answer.